AI Agents
Autonomous systems that reason, call tools, and act within permissions you define — observable end to end.
Learn more →grid turns disconnected data and models into dependable, self-running systems — engineered as one coherent platform, not a bundle of tools.
Trusted by teams building on the region's cloud
Every grid project can ship on a domain we register and secure for you.
Every capability shares the same data model, identity, and control plane — so what you build compounds instead of fragmenting.
Autonomous systems that reason, call tools, and act within permissions you define — observable end to end.
Learn more →Multi-tenant products with billing, auth, analytics, and admin built in from day one.
Learn more →Scalable, observable, secure infrastructure on AWS and Google Cloud, run with you.
Learn more →Senior product-engineering teams that ship, integrate, and stay accountable.
Learn more →Modernise legacy systems into a single, intelligent operating layer.
Learn more →We map your data, systems, and goals — and agree what "done" means.
Architecture and interfaces, built on the grid design system from day one.
Short iterations, real environments, observability wired in from the start.
We run it with you — SLAs, monitoring, and continuous improvement.
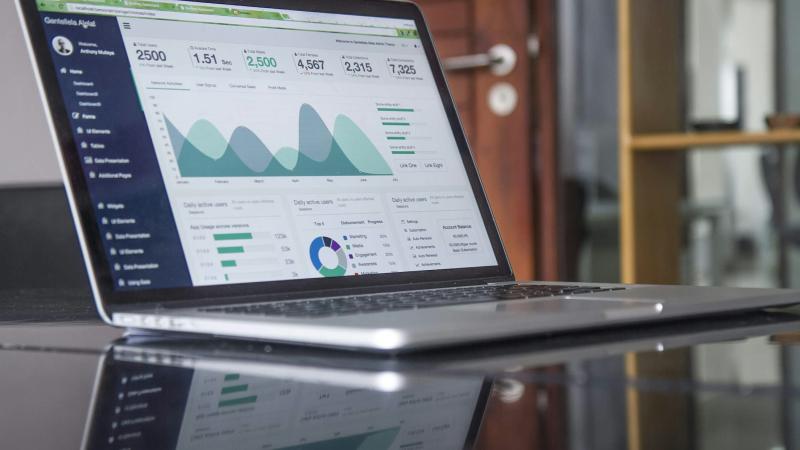
Most dashboards die a quiet death: built with enthusiasm, shown once at the launch meeting, and unopened two weeks later. The problem is rarely the data — it's design that shows everything and says nothing. A successful dashboard isn't a gallery of charts; it's a daily decision tool. In this article we distill the principles we use at Grid to design dashboards people open every morning because they actually answer their questions.Start from the decision, not the dataThe wrong question when building a dashboard: "what data do we have?". The right one: "what decisions does this dashboard's user make every week?". Every element must answer a specific question that leads to action — "do we need to intervene today?", "where are customers leaking?". A chart that changes no decision is noise, however beautiful.Every chart on the dashboard answers a question — if you can't write the question down, delete the chart.Data-ink: every pixel earns its placeEdward Tufte's famous principle: give as much "ink" as possible to the data itself, and as little as possible to decoration. In practice that means removing shaded backgrounds, heavy borders, gradients, drop shadows, dense gridlines, and 3D effects — they all compete with the data for the eye's attention and add no information. A clean dashboard isn't an aesthetic preference; it's reading speed.One accent color is enoughA dashboard using ten colors distinguishes nothing — when everything shouts, nothing is heard. The system that works: quiet grays for the base, one accent color for what matters most — the line that matters now, the segment that needs attention — and red reserved exclusively for genuine warnings. With that discipline, color guides the reader's eye to what deserves it within a second.Hierarchy guides the eyeReaders scan dashboards; they don't read them line by line. Design for that behavior: the critical numbers at the top, large and unmissable; supporting detail beneath; deep exploration at the last level or behind a click. And the one-screen rule: what needs long scrolling won't be seen — if sections multiply, split them into dashboards for different audiences instead of one endless screen.Choose the chart that matches the questionTrend over time — a line. Nothing beats it.Comparison across categories — bars, sorted largest to smallest.One critical number — a big number with its change indicator versus the previous period, not a speedometer gauge.Pie charts — rarely: two or three slices at most, otherwise bars are clearer.And watch for bar-chart axes that don't start at zero — they inflate differences and deceive the reader, and a dashboard's credibility is its most valuable asset.A number without context is not information"Revenue: 48,000" — is that good? Nobody knows without a comparison. Every number on the dashboard needs a reference: the previous period, the target, or the market average. Add the target line to the chart, the change percentage next to the number, and color the deviation — then the number turns from a statistic into a verdict: we're fine, or we need to act.For Arabic audiences: the dashboard reads from the rightBilingual dashboards are a challenge we handle daily: in the Arabic interface the entire layout mirrors (RTL), so the visual hierarchy starts at the top right — while time axes inside charts still run left-to-right as readers expect for numbers. Long numbers and dates need correct locale formatting. Test both versions — a dashboard that reads naturally in Arabic doesn't come for free from a foreign charting library.A pre-launch dashboard checklistDoes every chart answer a clear decision question you can write in one sentence?Have you removed every decoration that carries no information — backgrounds, shadows, 3D?Do you use one accent color, with red only for warnings?Is the most important content at the top, everything visible without long scrolling?Is every number paired with a comparison that gives it meaning — a target or a previous period?The bottom lineA good dashboard isn't the one with the most charts but the one that answers fastest: the decision-maker opens it and knows within seconds whether things are fine and where to look. Start from the questions, be frugal with ink and color, order by hierarchy, and give every number its context — and you'll get that rare thing: a dashboard people open every day by choice.At Grid we design bilingual dashboards and interactive reports for companies and organizations — from data modeling to an interface that actually gets read. If your dashboards get built but never opened, get in touch.

Every successful SaaS platform reaches the same moment: dozens, then hundreds of tenants on the same infrastructure, and one question deciding the product's future — was multi-tenancy designed in from the start, or patched on later? The gap between those two is the gap between quiet growth and nights of cross-customer data-leak incidents. In this article we summarize the isolation, authentication, and billing patterns we apply at Grid when building multi-tenant platforms that scale without the pain.Choose your isolation model deliberately — not by accidentThe isolation decision is the platform's most important architectural choice, with three main patterns:Database per tenant — strongest isolation and easiest compliance, but operational cost multiplies with every customer. Right for large clients and strictly regulated sectors.Shared schema with a tenant ID — the most operationally efficient and fastest to grow, but it puts the entire isolation burden on code discipline.Hybrid — shared schema for the general tier, dedicated databases for those who pay for isolation. The pattern most mature platforms end up with.There is no "correct" model — there is the model that fits today's customers while leaving the door open for tomorrow's.The tenant ID flows through every layer — and defense has multiple linesIn the shared model, the worst possible incident is a query that forgot the tenant filter and showed one customer's data to another. Protection isn't left to human attention; it's built in layers: a mandatory tenant context on every request, a data-access layer that adds the filter automatically and can't be bypassed, and row-level security (RLS) in the database as a last line of defense that works even when the code is wrong.Then automated tests that deliberately attempt cross-tenant access — failing the build in CI before the hole ever reaches production.Authentication: identity is one thing, membership is anotherThe pattern that lasts: one identity per user, multiple tenant memberships, and roles per membership. That handles the real-world cases smoothly — a consultant working with three companies, an employee moving between teams — without duplicate accounts. And with your first enterprise customer comes the SSO request (SAML or OIDC); build the integration point early, because it's a deal requirement, not a luxury feature.Billing starts with meteringYou can't bill what you don't measure. From day one, record usage per tenant — active users, storage, API calls, or whatever unit reflects value in your product — in an event stream independent of the billing logic itself. Then you can lay any pricing model on top of the data: plans, pay-as-you-go, or a mix, and change it later without a rebuild.And connect plan limits to actual enforcement: a plan promising ten users must be enforced by the system automatically, with a polite upgrade prompt rather than a cryptic error.The noisy neighbor: resource fairnessOn shared infrastructure, one heavy tenant — a million-row import, a runaway integration — can slow the platform for everyone. Prevention: rate limits per tenant rather than per system, processing queues that separate heavy work from the interactive path, and per-tenant monitoring that shows who is consuming what before the others start complaining.Migrations across a fleet of databasesIf you chose database-per-tenant, every schema migration becomes a fleet operation: automation that rolls the migration out gradually, verifies success per database, and halts the rollout at the first failure. Without it, tenants drift across schema versions — a mess that's very hard to come back from.A pain-free multi-tenancy checklistIs your isolation model a documented, deliberate decision — not an inherited default?Does the tenant ID flow mandatorily through every layer, with RLS as the last line of defense?Is identity separate from membership, with an SSO integration point ready for enterprise customers?Do you meter usage per tenant from day one, with limits enforced automatically?Do you have per-tenant rate limits and segmented monitoring that exposes the noisy neighbor?The bottom lineMulti-tenancy isn't a feature you add later; it's a lens you design every layer through: isolation, identity, metering, and operational fairness. Platforms that build it in grow from ten customers to a thousand quietly; platforms that patch it on pay in incidents and customer trust. Early investment here is the cheapest insurance for your product's future.At Grid we design multi-tenant SaaS platforms from scratch and fix multi-tenancy pain in existing ones. If you're building your platform or preparing for your first enterprise customer, get in touch.
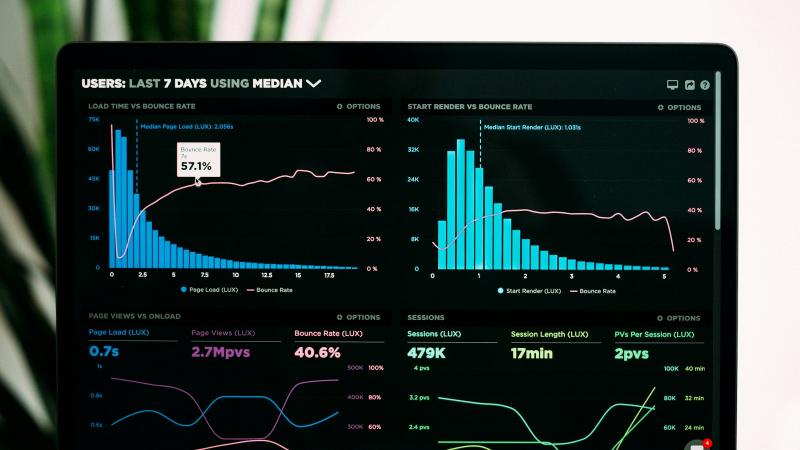
In most projects, observability gets added after the first painful incident: hours of guessing in the dark, then a belated decision that "we need better monitoring." The saner — and far cheaper — approach is to build observability from day one, as part of the definition of done for every new feature. In this article we walk through the three pillars we establish at Grid with every system we build, and why AI systems have made that foundation more urgent than ever.Watching charts is not observabilityThe difference is fundamental: traditional monitoring answers questions you decided on in advance — "what's the CPU usage?". Observability lets you ask questions you hadn't thought of when you built the system: "why do this specific customer's requests fail after 8 p.m.?". Real incidents are always the second kind — new questions nobody predicted.An observable system answers questions that haven't been asked yet — without shipping new code to collect the data.Pillar one: structured logs, not free textA text log line like "payment error occurred" is read by one human; a structured log (JSON with stable fields) is queried by machines across millions of lines. From day one we commit to: every log line carries a correlation ID that follows the request across all services, an accurate severity level, and field names that are consistent across the entire system.The payoff shows in the first investigation: instead of digging through scattered files, one query returns the request's full journey from the gateway to the database.Pillar two: metrics that matter to the userCPU and memory are useful, but they don't tell you whether users are suffering. The four golden signals are the foundation:Latency — specifically p95 and p99, not the average that flatters the picture.Traffic — requests per second, for context and peak awareness.Error rate — the share of failing requests, segmented by type and route.Saturation — how close resources are to their limits before they tip over.These four per service, with one dashboard bringing them together, surface 90% of problems before customers report them.Pillar three: distributed tracing ties the story togetherIn a multi-service system, logs and metrics tell you something is slow — distributed tracing tells you where. Every request carries a trace context that travels across services, so you see the journey as a waterfall: which service consumed the time, which call repeated needlessly. The OpenTelemetry standard has made this achievable with reasonable effort and no vendor lock-in.AI systems raise the stakesWith agents and language models, the question is no longer "which service is slow?" but "why did the agent make that decision?". So we extend tracing to cover every run: the prompts used and their version, every model call with its inputs and outputs, every tool call with its result — all tied to a single run ID. Without that trail, debugging agent behavior in production is pure guesswork; with it, every decision is explainable and reviewable.Alert on symptoms, investigate causesToo many alerts are more dangerous than too few — the team learns to ignore them. The rule: page only on what touches users (error rate over threshold, noticeable latency, full outage), and make every alert actionable with a direct link to the investigation dashboard or the runbook. Internal-cause warnings — a filling disk, a lagging replica — go to daily review boards, not to waking someone at dawn.A day-one checklistAre your logs structured with consistent fields and a correlation ID on every request?Do you measure the four golden signals per service, in percentiles rather than averages?Does distributed tracing flow through all your services via OpenTelemetry?Do your AI systems record every decision with its calls and outputs?Is every human-waking alert tied to real user impact and a clear action?The bottom lineObservability is an investment that compounds with every incident: what would have taken a night of guessing becomes a minutes-long query. Start it on day one — structured logs, golden signals, distributed tracing, and a full trail of AI decisions — and you'll find that most major incidents were small signals that showed up early and nobody saw.At Grid we build observability into every system we deliver — from day one, not after the first incident. If your system runs as a black box and you want to see inside it, get in touch.
Book a free consultation. We start from your problem — not a template.
No spam. One reply from a real engineer.