Reliability
Everything we have filed under this category.
2 items
Observability from day one
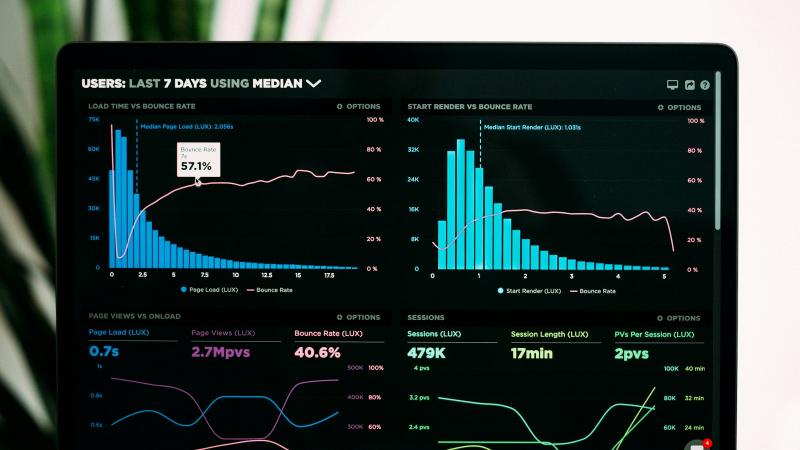
In most projects, observability gets added after the first painful incident: hours of guessing in the dark, then a belated decision that "we need better monitoring." The saner — and far cheaper — approach is to build observability from day one, as part of the definition of done for every new feature. In this article we walk through the three pillars we establish at Grid with every system we build, and why AI systems have made that foundation more urgent than ever.Watching charts is not observabilityThe difference is fundamental: traditional monitoring answers questions you decided on in advance — "what's the CPU usage?". Observability lets you ask questions you hadn't thought of when you built the system: "why do this specific customer's requests fail after 8 p.m.?". Real incidents are always the second kind — new questions nobody predicted.An observable system answers questions that haven't been asked yet — without shipping new code to collect the data.Pillar one: structured logs, not free textA text log line like "payment error occurred" is read by one human; a structured log (JSON with stable fields) is queried by machines across millions of lines. From day one we commit to: every log line carries a correlation ID that follows the request across all services, an accurate severity level, and field names that are consistent across the entire system.The payoff shows in the first investigation: instead of digging through scattered files, one query returns the request's full journey from the gateway to the database.Pillar two: metrics that matter to the userCPU and memory are useful, but they don't tell you whether users are suffering. The four golden signals are the foundation:Latency — specifically p95 and p99, not the average that flatters the picture.Traffic — requests per second, for context and peak awareness.Error rate — the share of failing requests, segmented by type and route.Saturation — how close resources are to their limits before they tip over.These four per service, with one dashboard bringing them together, surface 90% of problems before customers report them.Pillar three: distributed tracing ties the story togetherIn a multi-service system, logs and metrics tell you something is slow — distributed tracing tells you where. Every request carries a trace context that travels across services, so you see the journey as a waterfall: which service consumed the time, which call repeated needlessly. The OpenTelemetry standard has made this achievable with reasonable effort and no vendor lock-in.AI systems raise the stakesWith agents and language models, the question is no longer "which service is slow?" but "why did the agent make that decision?". So we extend tracing to cover every run: the prompts used and their version, every model call with its inputs and outputs, every tool call with its result — all tied to a single run ID. Without that trail, debugging agent behavior in production is pure guesswork; with it, every decision is explainable and reviewable.Alert on symptoms, investigate causesToo many alerts are more dangerous than too few — the team learns to ignore them. The rule: page only on what touches users (error rate over threshold, noticeable latency, full outage), and make every alert actionable with a direct link to the investigation dashboard or the runbook. Internal-cause warnings — a filling disk, a lagging replica — go to daily review boards, not to waking someone at dawn.A day-one checklistAre your logs structured with consistent fields and a correlation ID on every request?Do you measure the four golden signals per service, in percentiles rather than averages?Does distributed tracing flow through all your services via OpenTelemetry?Do your AI systems record every decision with its calls and outputs?Is every human-waking alert tied to real user impact and a clear action?The bottom lineObservability is an investment that compounds with every incident: what would have taken a night of guessing becomes a minutes-long query. Start it on day one — structured logs, golden signals, distributed tracing, and a full trail of AI decisions — and you'll find that most major incidents were small signals that showed up early and nobody saw.At Grid we build observability into every system we deliver — from day one, not after the first incident. If your system runs as a black box and you want to see inside it, get in touch.
How we hold 99.98% across regions
99.98% is not a marketing slogan — it's less than two hours of downtime in an entire year. Reaching that number in system availability doesn't come from buying bigger servers; it comes from architectural decisions that assume every component will eventually fail: the server, the database, the network, even an entire cloud region. In this article we walk through the practical playbook we follow at Grid to hold high availability across multiple regions, from honest service-level objectives to deliberately testing failure.Start with an error budget, not a promiseThe first step toward real availability is an honest number. An SLA that promises 100% is a polite lie; mature teams define a measurable service-level objective (SLO) and derive an error budget from it: the number of minutes of degradation allowed before new feature releases pause in favor of stability work.The error budget turns reliability from an emotional debate into an engineering decision: burn the budget early and risk-taking freezes automatically; keep it healthy and you've earned safe room to experiment and ship fast.A single region is a single point of failure — no matter how bigThe best architecture inside one cloud region can vanish entirely due to a provider outage, a routing mistake, or a datacenter-level incident. That's why we design from day one around at least two regions: a primary serving traffic and a secondary ready to take over.The question is not "will the region fail?" but "how many minutes do we need to move traffic away when it does?"Effective failover needs three pieces working together: DNS routing with a short TTL (or a global load balancer), a fresh copy of the data in the secondary region, and automation that shifts traffic without waiting for a human decision at 3 a.m.Data is the hard partMoving web traffic between regions is relatively easy; data is what's hard. For every system we pin down two numbers explicitly: RPO (how many seconds of data we can afford to lose in the worst case) and RTO (how many minutes we need to be back up). Those two numbers dictate the replication mode:Synchronous replication — zero data loss, but it adds latency and limits the distance between regions.Semi-synchronous replication — the practical balance: a few seconds of lag in exchange for normal performance.Asynchronous replication + continuous backups — for systems that can tolerate losing a few minutes.What matters is that the choice is a conscious decision per system — not one default silently imposed on everything.Health checks that tell the truthPlenty of systems show "green" on the dashboard while being effectively down, because the health check only tests that the process is alive — not that it's serving users. An honest check exercises the real path: it queries the database, touches the cache, verifies critical external dependencies — then decides. And based on it, the load balancer pulls a server or a whole region out of service automatically.Test failure before it tests youA failover plan that has never been exercised isn't a plan — it's a wish. We schedule regular drills where we deliberately take down the primary region in production (or an environment that mirrors it) and measure in minutes: when did the system detect the failure? When did traffic move? Was any data lost? Every drill exposes a wrong assumption that would otherwise have surfaced during a real customer-facing incident.The most valuable side effect: the team rehearses the procedure until it becomes boring routine — which is exactly what you want in a real emergency.Incidents will happen — prepare the script, not the heroicsEven with all of the above, incidents will happen. The difference between a 5-minute outage and a 5-hour one is operational readiness: a clear runbook for every scenario, alerts that reach the right person the first time, a public status channel for customers, and a blameless post-incident review that produces root-cause fixes instead of patches.A high-availability checklistDo you have a written SLO and an error budget reviewed monthly?Does your service run from at least two regions, with failover tested in the last quarter?Have you defined RPO and RTO per data system — and does the actual replication meet them?Do your health checks exercise the real path, not just process liveness?Do you keep an up-to-date runbook for every major failure scenario?The bottom lineHigh availability is not a product you buy but a set of habits you build: honest targets that drive decisions, a second region always ready, consciously replicated data, health checks that tell the truth, and failure rehearsed on a schedule before it shows up unannounced. With those habits, a number like 99.98% becomes a natural outcome — not a miracle.At Grid we design and operate highly available cloud architectures across multiple regions for our clients. If your system can't afford to go down, get in touch — we'll help you build reliability that is measured in numbers, not promises.